Potential circuit diagram
 A diagram of the potential is called a graphical representation of the distribution of the electric potential along a closed loop, depending on the resistance of the sections included in the selected loop.
A closed loop is chosen to construct a potential diagram. This circuit is divided into sections in such a way that there is one user or source of energy per section. Boundary points between sections must be marked with letters or numbers.
One point of the loop is arbitrarily grounded, its potential is conditionally considered to be zero. Going around the contour clockwise from a point of zero potential, the potential of each subsequent boundary point is defined as the algebraic sum of the potential of the previous point and the change of potential between these adjacent points.

If there is an EMF source on the object, then the potential change here is numerically equal to the EMF value of this source. If the direction of bypass of the loop and the direction of EMF coincide, the potential change is positive, otherwise it is negative.
After calculating the potentials of all points, a potential diagram is constructed in a rectangular coordinate system. On the abscissa, the resistance of the sections is drawn to scale in the sequence in which they meet when crossing the contour, and on the ordinate, the potentials of the corresponding points. The potential diagram starts at zero potential and ends after cycling through it.
Construct a potential circuit diagram
In this example, we construct a potential diagram for the first loop of the circuit whose diagram is shown in Figure 1.
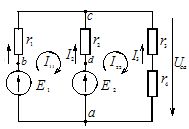
Rice. 1. Diagram of a complex electrical circuit
The considered circuit includes two power supplies E1 and E2, as well as two energy consumers r1, r2.
We divide this contour into sections, the boundaries of which are indicated by the letters a, b, c, d. We ground point a, conventionally considering its potential to be zero, and circle the contour clockwise from this point. Therefore, φα = 0.
The next point on the path to cross the contour will be point b. The EMF source E1 is located in section ab. As we move from the negative to the positive pole of the source in this section, the potential increases by the value E1:
φb = φa + E1 = 0 + 24 = 24 V
When moving from point b to point c, the potential decreases by the size of the voltage drop across the resistor r1 (the bypass direction of the loop coincides with the direction of the current in the resistor r1):
φc = φb — Az1r1 = 24 — 3 x 4 = 12V
As you go to point d, the potential increases by the amount of voltage drop across resistor r2 (in this section, the direction of current is opposite to the direction of the loop bypass):
φd = φ° C + I2r2 = 12 + 0 NS 4 = 12 V
The potential of point a is less than the potential of point d by the value of the EMF of the source E2 (the direction of the EMF is opposite to the direction of bypassing the circuit):
φa = φd — E2 = 12 — 12 = 0
The results of the calculations are used to build a potential diagram. On the abscissa axis, the resistance of the sections is plotted in series, as it would be when the circuit is surrounded by a point of zero potential. The previously calculated potentials of the corresponding points are plotted along the ordinate (Fig. 2).
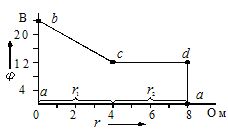
Drawing 2… Potential contour diagram
Patskevich V.A.