Daily load curves of residential buildings
 The operating modes of household electrical appliances are different. They vary depending on the purpose and use of these devices in the family. The nature of the load change is most clearly visible in the so-called daily load schedule, and depending on the number of connected apartments, the day of the week and the time of the year, these schedules differ from each other.
Due to the fact that the maximum loads in the networks supplying domestic consumers are observed in winter, the daily load graphs of the winter day are of greatest interest. In addition, the nature of the loading schedule is significantly influenced by the way the food is prepared.
From this point of view, daily charging schedules can be divided into three main groups, depending on the cooking method:
-
for buildings with gas stoves,
-
solid fuel stoves
-
electric stoves.
Below are the characteristics of schedules for buildings with gas and electric furnaces.
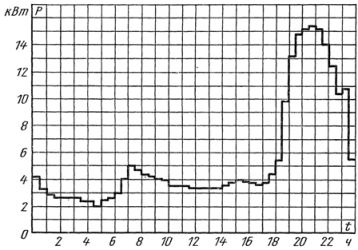
Rice. 1. Average daily load schedule at the entrance of a 62-residential building with gas stoves.
The shape of the daily load schedule and its characteristics (filling) as well as the maximum load vary widely. Therefore, for research, average typical load curves determined by a number of graphs for the average half-hourly loads.
For the elements of the networks supplying apartments with gas stoves, the average schedules are determined for all days of the week, including Saturdays and Sundays, since there is no big difference in the load schedule for the days of the week in these networks. For elements of the networks supplying apartments with electric stoves, average schedules are determined for weekends (Saturday and Sunday) and for weekdays, since in these networks the load schedules for work and weekends differ from each other.
A characteristic feature of the weekend load schedule is the presence of morning and daytime peak loads, which are close in size to the evening peak load on weekdays.
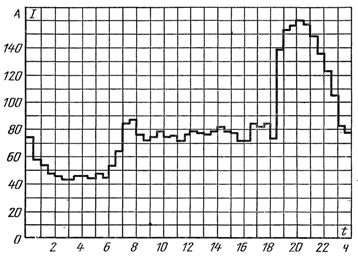
Rice. 2. Average daily schedule of a residential building (501 apartments with gas stoves) in buses at substations. Measurements were made with self-recording ammeters.
The average loads are determined from the readings of the meter by the value of the recorded energy for the corresponding period of time (usually 30 minutes). To construct an average graph, the average loads recorded at the same time are summed, for example at 14:00 (14:30, 15:00, etc.) on all days of the week, and then the resulting value is divided at seven.
In fig. 1 shows the average daily load schedule at the entrance of a 62-residential building with gas stoves. Figure 2 shows the average daily load schedule of residential buildings (501 apartments) in the buses of a transformer substation. In fig.3 shows a similar schedule at the entrance of a 108-unit building with electric stoves for weekdays and weekends. From the graph in fig. 1 it follows that in the networks of buildings with gas stoves in Moscow, the winter maximum load occurs around 18:00 and lasts until 22-23, but the highest load value is observed from 20 to 21
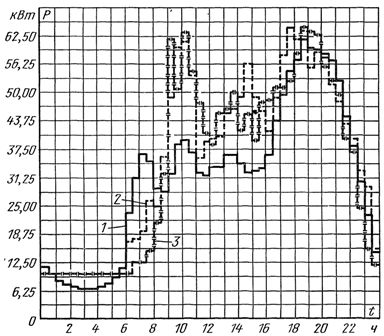
Rice. 3. Average daily load schedule at the entrance of a 108-residential building with electric stoves. 1 — working day, 2 — Saturday, 3 — Sunday.
Daily load schedule fill factor

is in the range of 0.35-0.5.
The morning maximum load lasts 2 hours: from 7 to 9 am and is equal to 35-50% of the evening maximum; daytime load is 30–45% and night load is 20–30%.
In networks supplying apartments with electric stoves, on weekdays the evening maximum load coincides in time with the maximum load of houses with gas stoves. The morning maximum starts at 6:00 AM and lasts until 11:00 AM. The morning maximum is in the range of 60-65% of the evening maximum. The daytime load is 50-60%, and the night-20%. The fill factor of the daily load schedule varies from 0.45 to 0.55.
On Saturdays and Sundays, in addition to the evening maximum from 21:00 to 23:00, there is also a morning maximum, approximately equal in magnitude to the evening one, and a maximum daytime load from 13:00 to 17:00, equal to 85-90% of the evening maximum. For such days, the schedule fill rate is higher than on weekdays. The given data are typical for large cities. In small towns and villages where worker turnover plays a significant role, load schedules may differ from those discussed below.
The widespread use of household electrical appliances equipped with low-power electric motors led to a decrease in the power factor to 0.9-0.92 in houses with gas stoves during the evening peak load, and during the rest of the day to 0. 76-0.8. In houses with electric stoves, the power factor is higher and is 0.95 both during the day and in the evening, and 0.8 at night.
This circumstance is very important and must be taken into account when designing electrical networks, because until now the design was carried out without taking this factor into account. The power factor is assumed to be practically unity, which is true when the main load is electric lighting made with incandescent lamps.
The load of a residential building is characterized, as a rule, by the use of single-phase electrical receivers. This cannot fail to affect the distribution of loads on the phases of the electrical network. The loads on the individual phases turn out to be unequal. Despite the fact that both in the design, installation and operation of electrical installations in residential buildings, measures are taken to distribute the loads on the phases as evenly as possible, studies show that in fact the unevenness of the phase load is often significant.
The situation was aggravated by the connection with the widespread use of household electrical appliances (refrigerators, washing machines, TVs, radios, etc.), which have different and largely random modes of operation, as a result of which the asymmetry of phase loads in urban networks became inevitable .
For example, according to Mosenergo, even in external networks with, as a rule, three-phase entrances to buildings, with good organization of work and regular monitoring, it was not possible to achieve an asymmetry of phase loads below 20%. The situation is even worse with low-rise buildings, typical of small towns and villages, where building entrances are mostly single-phase. Studies conducted in Moscow during simultaneous measurement of loads on all three phases, as well as on the neutral conductor of four-wire networks, confirmed the above.
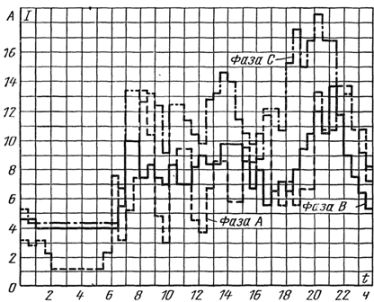
Rice. 4. Graphs of average daily load by phases of a riser in a house with electric stoves.
In the networks inside the house, especially in the networks of buildings with electric stoves, there is a significant asymmetry of phase loads, due not only to the uneven distribution of single-phase electrical receivers, but also mainly to the natural time of switching on and off electrical appliances. To illustrate what was said in fig. 4 shows the average daily schedule for each phase of the riser in a house with electric stoves. Characteristically, the given graphs are for a line, to each phase of which an equal number of apartments are connected.
The results of data processing obtained during the measurements are shown in a table. 1 (according to the laboratory of electrical equipment MNIITEP).
Table 1 Data for measuring phase loads
Settings Phase A Phase B Phase C Average values Average load Рm, kW 4.25 3.32 4.58 4.1 Standard deviation σр, kW 1.53 0.65 0.47 0.61 Maximum design load Pmax, kW 8 .84 5.3 6.1 5.93 Unit load per apartment, kW / apartment — — — 1.77
Assessment of load asymmetry
To estimate the asymmetry of the loads, you can use the concept of the asymmetry factor of the phase loads during peak hours, which is the ratio of the current in the neutral conductor I0 to the current of the average phase load Iav.

Design load values:
— regardless of asymmetry

— taking into account the asymmetry P

where: PMSRF — maximum calculated average phase load (per phase);
Pmkasf — maximum calculated average phase load of the most loaded phase.
The ratio of the last two formulas is called the coefficient of transition from the design load without taking into account the asymmetry to the design load, taking into account the asymmetry:

The processing of individual phase and general load graphs showed that in the internal electrical networks of houses with gas stoves, the asymmetry of phase loads with average thirty-minute values during peak load hours is within 20%. The design load for the maximum loaded phase is 20-30% higher than the design maximum of the average phase load.
In houses with electric stoves, the asymmetry of the phase loads at the entrance to a building of a hundred apartments is 20-30%, and in the internal power supply networks (for highways supplying 30-36 apartments, the asymmetry reaches 40-50%). In this way, the need to take into account the asymmetry of the phase loads when choosing the parameters of the electrical network was established; it should be borne in mind that as the number of connected apartments increases, the asymmetry decreases.Unaccounted for asymmetry of phase loads can lead to significant errors in the selection of cross-sections of wires and cables.
In the design, the asymmetry is taken into account by a corresponding increase in the values of the normalized specific electrical loads (kW / apartment), i.e. the calculation is performed for the most loaded phase.
In the supply transformer busbars, the asymmetry of the phase loads affects only slightly and may be neglected.
It should be mentioned that with a significant asymmetry of phase loads due to the appearance of reverse and zero-sequence currents in the network, additional voltage and power losses are obtained, which worsens the economic indicators of the network and the quality of voltage at energy consumers.