Electrical load curves
 Electric load curves allow you to correctly approach the selection of the main equipment of substations — transformers, compensating devices, cables and outline the most economical mode of their operation.
With continued concern, electrical load charts help identify key indicators electrical loads, which are necessary for the design of power supply for such industries.
Daily charts show the change in loads during the day. They are built according to the readings of active and reactive energy meters every hour or every half hour (to identify the half-hour peak load).
In the design, typical daily schedules characteristic of a given type of production are used, where the maximum daily load is taken as unity or 100%, and the remaining loads are expressed in fractions of unity or in percentages. To build a specific daily schedule, you need to know the maximum load and have a typical daily schedule.
The following values are typical for daily graphs of active and reactive loads: maximum active (reactive) load per day P'm (Q'm) kW (kvar), the maximum active load in the busiest shift Pm kW, consumption of active (reactive ) energy per day Wcut (Vday), kWh (kvar-h), active (reactive) energy consumption for the busiest shift Wcm (Vcm), kWh (kvar-h).
Using these characteristic values and knowing the total nominal power of all operating electrical receivers (Pi, kW), it is possible to determine the following indicators characteristic of daily graphs:
Average active load per day (kW):
Rsut = Wday / 24,
Average active load for the busiest shift (kW):
Rcm = Wcm/8,
YES SE coefficient of use of the nominal power Pn for the busiest shift:
LET Eu = Pcm / Pn,
YES Peak power factor:
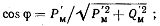
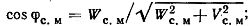
Weighted average power factor for the busiest shift
YES, fill factor of the daily schedule of active and reactive load:
Book a = Wday /P 'm24, Kn.r = Vday /Q 'm24
YES Maximum active load factor for the busiest shift:
DA SEm = Pm/ Rcm
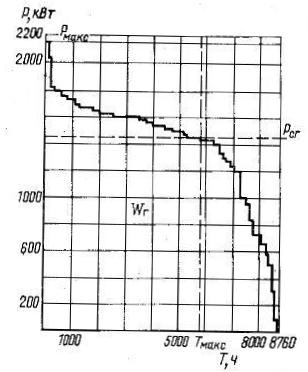
Annual graphs of active and reactive loads in terms of duration, built on the basis of daily or monthly load graphs, they make it possible to clarify the amount of annual electricity consumption, to outline the mode of operation of substation transformers during the year and to the correct compensating devices are selected.
The annual graphs of active and reactive loads in terms of duration are characterized by the following values: annual maximum active (reactive) load Pm.(Qm.g), kW (kvar), annual consumption of active (reactive) energy Wg (VG), kWh (kvar-h).
The following characteristic indicators will be derivatives for these charts:
GA number of hours of use of the maximum active (Hm, h) and reactive (Hm. P, h) loads:
Tm = Wg / Rm.G, Tm.p = VG/Bm.,
Annual average active (strkr, kW) and reactive (Qsg, kvar) loads:
Pkr = WG/ TG, QcG = VG/ TG,
where Тt is the annual fund of working time, h,
A shift factor for energy use:
α = Pkr/Rcm,
YES SEFilling factor of the annual graphs of active and reactive loads:
Until n.a. r = WGPm.GTG, Book. R. r = VGВm.Tg.
In order to analyze and compare the indicators obtained in one enterprise with the indicators of similar industries of other enterprises, it is necessary to supplement the graphs of electrical loads with data characterizing the production technology in the time period corresponding to the graphs.
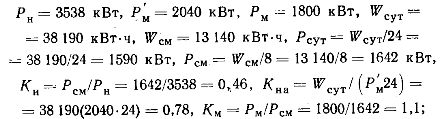
As an example, FIG. Figures 1 and 2 show daily and annual schedules of active loads for a 5.5 million m2 per year plant constructed based on active energy meter readings during the study of the plant's electrical loads.
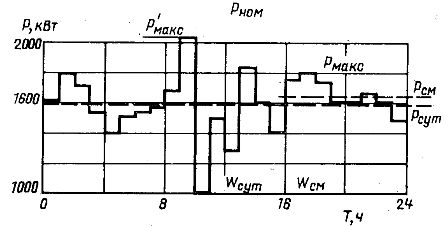
Rice. 1.
For the graphs presented, the characteristic indicators have the following meaning:
for the daily load schedule:
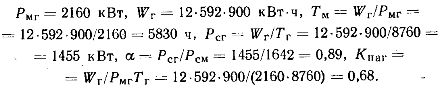
for the annual load schedule: