Graphical ways to display alternating current
Basic facts of trigonometry
 Learning AC is very difficult if the student has not mastered the basic information of trigonometry. Therefore, the basic provisions of trigonometry, which may be needed in the future, we give at the beginning of this article.
It is known that in geometry it is customary, when considering a right triangle, to call the side opposite the right angle the hypotenuse. The sides adjacent at right angles are called legs. A right angle is 90°. Thus in fig. 1, the hypotenuse is the side indicated by the letters O, the legs are the sides ab and aO.
In the figure, it is noted that the right angle is 90 °, the other two angles of the triangle are acute and are indicated by the letters α (alpha) and β (beta).
If you measure the sides of a triangle on a certain scale and take the ratio of the size of the leg opposite the angle α to the value of the hypotenuse, then this ratio is called the sine of the angle α. The sine of an angle is usually denoted sin α. Therefore, in the right triangle we are considering, the sine of the angle is:

If you make the ratio by taking the value of the leg aO, adjacent to the acute angle α, to the hypotenuse, then this ratio is called the cosine of the angle α. The cosine of the angle is usually denoted as follows: cos α. Thus, the cosine of the angle a is equal to:

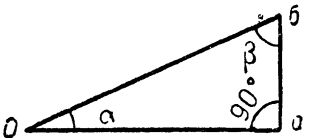
Rice. 1. Right triangle.
Knowing the sine and cosine of the angle α, you can determine the size of the legs. If we multiply the value of the hypotenuse O by sin α, we get leg ab. Multiplying the hypotenuse by cos α, we get the leg Oa.
Suppose that the angle alpha does not remain constant, but gradually changes, increasing. When the angle is zero, its sine is also zero, since the area opposite the leg angle is zero.
As the angle a increases, its sine will also begin to increase. The largest value of the sine will be obtained when the alpha angle becomes straight, that is, it will be equal to 90 °. In this case, the sine is equal to one. Thus, the sine of the angle can have the smallest value — 0 and the largest — 1. For all intermediate values of the angle, the sine is a proper fraction.
The cosine of the angle will be greatest when the angle is zero. In this case, the cosine is equal to unity, since the leg adjacent to the angle and the hypotenuse in this case will coincide with each other, and the segments represented by them are equal to each other. When the angle is 90 °, its cosine is zero.
Graphical ways to display alternating current
Sinusoidal alternating current or emf varying with time can be plotted as a sine wave. This type of representation is often used in electrical engineering. Along with the representation of an alternating current in the form of a sine wave, the representation of such a current in the form of vectors is also widely used.
A vector is a quantity that has a specific meaning and direction. This value is represented as a straight line segment with an arrow at the end. The arrow should indicate the direction of the vector, and the segment measured on a certain scale gives the magnitude of the vector.
All phases of the alternating sinusoidal current in one period can be represented using vectors acting as follows. Suppose that the origin of the vector is at the center of the circle, and its end lies on the circle itself. This counter-clockwise rotating vector makes a complete revolution in a time corresponding to one period of current change.
Let us draw from the point defining the origin of the vector, that is, from the center of the circle O, two lines: one horizontal and the other vertical, as shown in fig.
If for each position of the rotating vector from its end, denoted by the letter A, we lower the perpendiculars to a vertical line, then the segments of this line from point O to the base of the perpendicular a will give us instantaneous values of the sinusoidal alternating current, and the vector OA itself on a certain scale depicts the amplitude of this current, that is, its highest value. The segments Oa along the vertical axis are called projections of the vector OA on the y-axis.
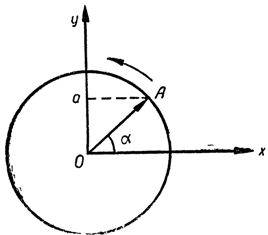
Rice. 2. Image of sinusoidal current changes using a vector.
It is not difficult to verify the validity of the above by performing the following construction. Near the circle in the figure, you can get a sine wave corresponding to the change in the variable emf. in one period, if on the horizontal line we draw the degrees that determine the phase of change in EMF, and in the vertical direction construct segments equal to the magnitude of the projection of the vector OA on the vertical axis.Having carried out such a construction for all points of the circle along which the end of the vector OA slides, we obtain Fig. 3.
The full period of the current change and, accordingly, the rotation of the vector that represents it, can be represented not only in degrees of a circle, but also in radians.
An angle of one degree corresponds to 1/360 of a circle described by its vertex. To measure this or that angle in degrees means to find how many times such an elementary angle is contained in the measured angle.
However, when measuring angles, you can use radians instead of degrees. In this case, the unit with which one or the other angle is compared is the angle to which the arc corresponds, equal in length to the radius of each circle described by the vertex of the measured angle.
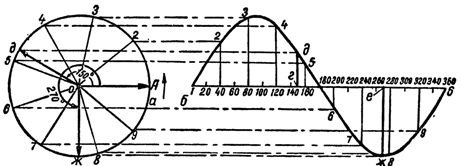
Rice. 3. Construction of the EMF sinusoid changing according to the harmonic law.
Thus, the total angle corresponding to each circle, measured in degrees, is 360 °. This angle, measured in radians, is equal to 2 π — 6.28 radians.
The position of the vector at a given moment can be estimated by the angular velocity of its rotation and by the time that has passed since the beginning of the rotation, that is, since the beginning of the period. If we denote the angular velocity of the vector with the letter ω (omega) and the time since the beginning of the period with the letter t, then the angle of rotation of the vector with respect to its initial position can be determined as a product:

The angle of rotation of the vector determines its phase, which corresponds to one or the other instantaneous current value… Therefore, the rotation angle or phase angle allows us to estimate what instantaneous value the current has at the instant of time we are interested in. Phase angle is often simply called phase.
It was shown above that the angle of complete rotation of the vector, expressed in radians, is equal to 2π. This complete rotation of the vector corresponds to one alternating current period. Multiplying the angular velocity ω by the time T corresponding to one period, we obtain the complete rotation of the alternating current vector, expressed in radians;

Therefore, it is not difficult to determine that the angular velocity ω is equal to:

Replacing the period T with the ratio 1 / f, we get:

The angular velocity ω according to this mathematical relationship is often called the angular frequency.
Vector diagrams
If not one current acts in an alternating current circuit, but two or more, then their mutual relationship is conveniently represented graphically. Graphical representation of electrical quantities (current, emf and voltage) can be done in two ways. One of these methods is to plot sinusoids showing all the phases of the change in electrical quantity during one period. In such a figure, you can see, first of all, what is the ratio of the maximum values of the investigated currents, emf. and stress.
In fig. 4 shows two sinusoids that characterize the changes in two different alternating currents. These currents have the same period and are in phase, but their maximum values are different.
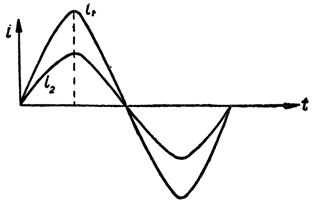
Rice. 4. Sinusoidal currents in phase.
Current I1 has a higher amplitude than current I2. However, currents or voltages may not always be in phase. Quite often it happens that their phases are different. In this case they are said to be out of phase. In fig. 5 shows sinusoids of two phase-shifted currents.
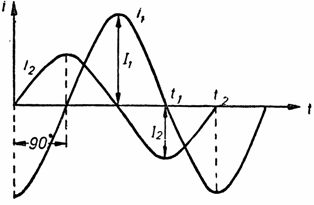
Rice. 5. Sinusoids of currents phase-shifted by 90 °.
The phase angle between them is 90 °, which is a quarter of the period.The figure shows that the maximum value of the current I2 occurs earlier by a quarter of the period than the maximum value of the current I1. The current I2 leads the phase I1 by a quarter period, that is, by 90 °. The same relationship between currents can be depicted using vectors.
In fig. 6 shows two vectors with equal currents. If we recall that the direction of rotation of the vectors is agreed to be taken counterclockwise, then it becomes quite obvious that the current vector I2, rotating in the conventional direction, precedes the current vector I1. Current I2 leads current I1. The same figure shows that the lead angle is 90 °. This angle is the phase angle between I1 and I2. The phase angle is denoted by the letter φ (phi). This way of displaying electrical quantities using vectors is called a vector diagram.
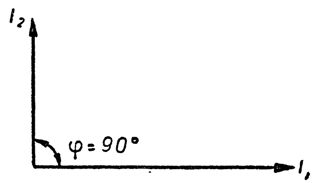
Rice. 6. Vector diagram of currents, phase shifted by 90 °.
When drawing vector diagrams, it is not at all necessary to depict circles along which the ends of the vectors slide in the process of their imaginary rotation.
Using vector diagrams, we must not forget that only electrical quantities with the same frequency, that is, the same angular speed of rotation of the vectors, can be depicted on one diagram.