What are vector charts and what are they for?
 The use of vector diagrams in calculation and research Electric circuits for alternating current allows you to visually represent the considered processes and simplify the electrical calculations performed.
When calculating alternating current circuits, it is often necessary to add (or subtract) several homogeneous sinusoidally different quantities of the same frequency, but with different amplitudes and initial phases. This problem can be solved analytically by trigonometric transformations or geometrically. The geometric method is simpler and more intuitive than the analytical method.
Vector diagrams are a set of vectors depicting the effective sinusoidal EMF and currents or their amplitude values.
The harmonically changing voltage is determined by the expression ti = Um sin (ωt + ψi).
Place at an angle ψi relative to the positive axis x, a vector Um, the length of which in an arbitrarily chosen scale is equal to the amplitude of the displayed harmonic quantity (Fig. 1). Positive angles will be plotted counterclockwise and negative angles clockwise.Suppose that the vector Um, starting from the moment of time t = 0, rotates around the origin of coordinates counterclockwise with a constant frequency of rotation ωequal to the angular frequency of the displayed voltage. At time t, the vector Um is rotated through an angle ωt and will be located at an angle ωt + ψi with respect to the abscissa axis. The projection of this vector on the axis of ordinates in the selected scale is equal to the instantaneous value of the indicated voltage: ti = Um sin (ωt + ψi).
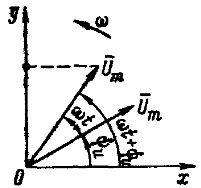
Rice. 1. Image of a sinusoidal voltage of a rotating vector
Therefore, a quantity that changes harmonically in time can be depicted as a rotating vector... With an initial phase equal to zero when ti = 0, the vector Um for t = 0 must lie on the abscissa axis.
The graph of the dependence of each variable (including harmonic) value on time is called a time graph... For harmonic quantities on the abscissa, it is more convenient to postpone not the time itself t, but the proportional value ωT ... The time diagrams completely determine the harmonic function, since give insight into initial phase, amplitude and period.
Usually, when calculating a circuit, we are interested only in the effective EMF, voltages and currents, or the amplitudes of these quantities, as well as their phase shift relative to each other. Therefore, fixed vectors are usually considered for a specific moment in time, which is chosen so that the diagram is visual. Such a diagram is called a vector diagram. Wherein the phase angles are applied in the direction of rotation of the vectors (counter-clockwise) if they are positive, and in the opposite direction if they are negative.
If, for example, the initial phase angle of the voltage ψi is greater than the initial phase angle ψi then the phase shift φ = ψi — ψi and this angle is applied in the positive direction by the current vector.
When calculating an AC circuit, it is often necessary to add emfs, currents, or voltages of the same frequency.
Suppose you want to add two EMFs: e1 = E1m sin (ωt + ψ1e) and e2 = E2m sin (ωt + ψ2e).
This addition can be done analytically and graphically. The last method is more visual and simple. Two folding EMFs e1 and d2 to a certain scale are represented by vectors E1mE2m (Fig. 2). When these vectors rotate with the same rotational frequency equal to the angular frequency, the relative position of the rotating vectors remains unchanged.
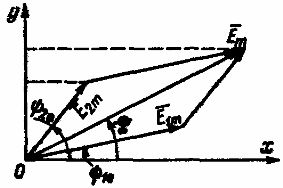
Rice. 2. Graphical summation of two sinusoidal EMFs with the same frequency
The sum of the projections of the rotating vectors E1m and E2m along the ordinate axis is equal to the projection on the same axis of the vector Em, which is their geometric sum. Therefore, when adding two sinusoidal EMFs with the same frequency, a sinusoidal EMF with the same frequency is obtained, the amplitude of which is represented by the vector Eequal to the geometric sum of vectors E1m and E2m: Em = E1m + E2m.
Vectors of alternating EMFs and currents are graphical representations of EMFs and currents, unlike vectors of physical quantities that have a certain physical meaning: force vectors, field strength, and others.
This method can be used to add and subtract any number of emfs and currents of the same frequency. The subtraction of two sinusoidal quantities can be represented as an addition: e1- d2 = d1+ (- eg2), that is, the decreasing value is added to the subtracted value taken with the opposite sign.Usually, vector diagrams are constructed not for the amplitude values of the alternating emfs and currents, but for the rms values proportional to the amplitude values, since all circuit calculations are usually performed for the rms emfs and currents.