Graphical representation of sinusoidal values
 In any linear circuit, regardless of the type of elements included in the circuit, a harmonic voltage causes a harmonic current, and vice versa, a harmonic current generates voltages at the terminals of these elements also with a harmonic form. Note that the inductance of the coils and the capacitance of the capacitors are also assumed to be linear.
In a more general case, we can say that in linear circuits with harmonic influences, all reactions also have a harmonic form. Therefore, in any linear circuit, all instantaneous voltages and currents have the same harmonic form. If the circuit contains at least a few elements, then there are many sinusoidal curves, these timing diagrams overlap, it is very difficult to read them, and the study becomes extremely inconvenient.
For these reasons, the study of processes occurring in circuits under harmonic influences is not carried out sinusoidal curves, and using vectors, the lengths of which are taken in proportion to the maximum values of the curves, and the angles at which the vectors are placed are equal to the angles between the origin of two curves or the origin of the curve and the origin.Thus, instead of time diagrams, which take up a lot of space, their images are displayed in the form of vectors, that is, straight lines with arrows at the ends, and the arrows for voltage vectors are shown shaded, and for current vectors they are left unshaded.
The set of vectors of voltages and currents in a circuit is called vector diagram… The rule for counting angles in vector diagrams is this: if it is necessary to show a vector lagging behind the starting position by some angle, then rotate the vector clockwise by that angle. A vector rotated counterclockwise means advance by the specified angle.
For example, in the diagram of fig. 1 shows three timing diagrams with the same amplitudes but different initial phases... Therefore, the lengths of the vectors corresponding to these harmonic voltages must be the same and the angles must be different. Let's draw mutually perpendicular coordinate axes, take the horizontal axis with positive values as the start, in this case the vector of the first stress should coincide with the positive part of the horizontal axis, the vector of the second stress should be rotated clockwise by an angle ψ2 , and the third voltage vector must be counterclockwise. arrows at an angle (Fig. 1).
The lengths of the vectors depend on the chosen scale, sometimes they are drawn with an arbitrary length in accordance with the proportions. Since the maximum and rms values of all harmonic quantities always differ by the same number of times (in √2 = 1.41), then the maximum and rms values can be plotted on vector diagrams.
The timing diagram shows the value of the harmonic function at any time according to the equation ti = Um sin ωt. A vector chart can also show the values at any point in time. To do this, it is necessary to represent the vector rotating in the counterclockwise direction with an angular velocity ω and take the projection of this vector on the vertical axis. The resulting projection lengths will obey the law ti = Um sinωt and therefore represent instantaneous values on the same scale. The direction of rotation of the vector counter-clockwise is considered positive and clockwise is considered negative.
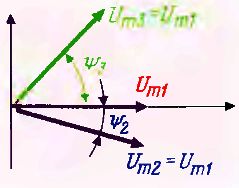
Fig. 1
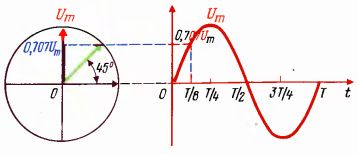
Fig. 2
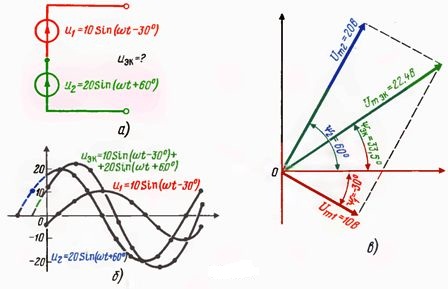
Fig. 3
Consider an example of determining instantaneous voltage values using a vector diagram. On the right side of fig. 2 shows a time diagram and on the left a vector diagram. Let the initial phase angle be zero. In this case, at the moment t = 0, the instantaneous value of the voltage is zero, and the vector corresponding to this time diagram coincides with the positive direction of the abscissa axis, the projection of this vector on the vertical axis at this moment is also zero, t .is the length of the projection matches the instantaneous value of the sine wave.
After time t = T / 8, the phase angle becomes equal to 45 °, and the instantaneous value Um sin ωt = Um sin 45 ° = = 0.707 Um. But the radius vector during this time will also rotate at an angle of 45 ° and the projection of this vector will also become 0.707 Um. After t = T / 4, the instantaneous value of the curve will reach U, but the radius vector is also rotated by 90 °. The projection on the vertical axis at this point will become equal to the vector itself, the length of which is proportional to the maximum value.Likewise, you can determine the current values at any time.
Thus, all operations that in one way or another must be performed with sinusoidal curves are reduced to operations performed not with sinusoids themselves, but with their images, that is, with their corresponding vectors. For example, there is a circuit in fig. 3, a, in which it is necessary to determine the equivalent curve of the instantaneous voltage values. In order to build a generalized curve graphically, it is necessary to carry out a very cumbersome operation of graphically adding two curves filled by points (Fig. 3, b). To analytically add two sinusoids, it is necessary to find the maximum value of the equivalent sinusoid:
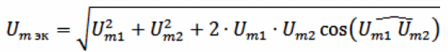
and the initial phase
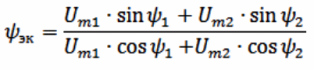
(In this example, Um eq is obtained equal to 22.36 and ψek = 33 °.) Both formulas are cumbersome, extremely inconvenient for calculations, so in practice they are rarely used.
Let us now replace the temporal sinusoids with their images, that is, with vectors. Let's choose a scale and set aside the vector Um1, which lags behind the origin of the coordinates by 30, and the vector Um2, which has a length 2 times greater than the vector Um1, advancing the origin of the coordinates by 60 ° (Fig. 3, c) . The drawing after such a replacement is significantly simplified, but all calculation formulas remain the same, since the vector image of sinusoidal quantities does not change the essence of the matter: only the drawing is simplified, but not the mathematical relations in it (otherwise, the replacement of time diagrams with vector would just be illegal.)
Thus, replacing harmonic quantities with their vector representations still does not facilitate the calculation technique if these calculations are to be performed according to the laws of oblique triangles. In order to drastically simplify the technology of calculating vector quantities, a symbolic method of calculation.