Interaction diagrams on electrical circuits
It is known that devices and their parts are shown in diagrams, as a rule, in the off position, that is, in the absence of coercive forces acting on the moving contacts. If a deviation is made from this rule, it is indicated in the drawings. But in any case, the diagram depicts every single position of the apparatus.
In practice, both when power is applied and disconnected, and during operation, changes occur in the circuit and these occur over time and in some cases must be reflected in the drawings. For this purpose, interaction diagrams are constructed.
The most common diagrams are of two types. The first type is the simplest and serves to depict the sequence of actions and calculate time in stationary modes. The second type is more complicated. They are intended for schemes operating in transient regimes, which are considered in the special literature.
Prerequisites and Scope
The number of rows in the diagram is equal to the number of devices whose interaction is considered.To facilitate the description of the schemes, the characteristic points of the diagram are numbered in ascending order from left to right (then they are easier to find). The characteristic points are connected by arrows showing the «direction of the process». Time is counted horizontally. The time scale for all devices is the same.
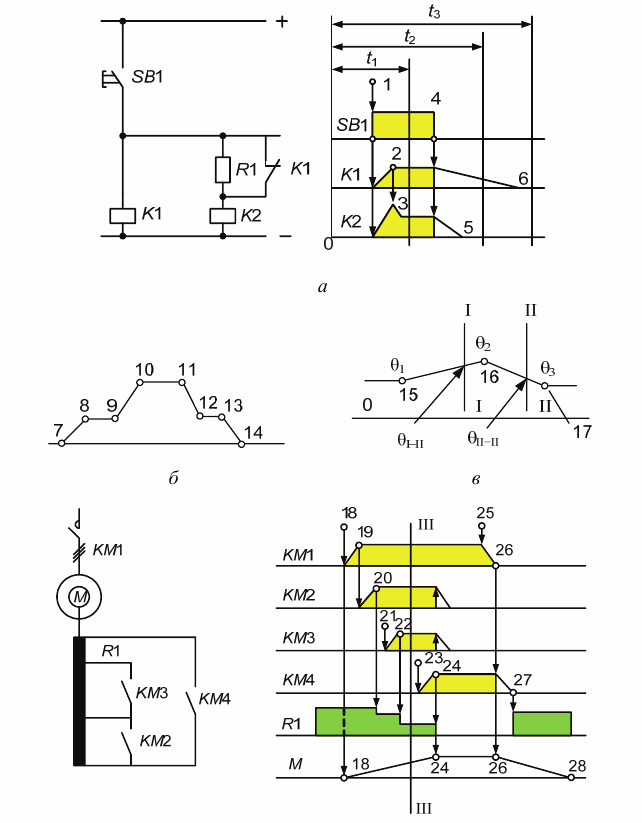
The operation of a single-position manually operated device, such as a switch, in the diagram of FIG. 1, and is shown with a rectangle. It shows that the switch SB1 is pressed at the time point indicated in point 1 and released at point 4. Therefore, its closing contact is closed during time 1-4, and the normally open contact is closed from 0-1 and from 4 onwards.
When on the diagram it is necessary to show the nature of the movement of a controlled mechanism with complex kinematics, then the movement is indicated by oblique lines, and the rest - horizontal. Let us analyze fig. 1, b. It depicts the operation of the mechanism as follows. When voltage is applied to the drive of the mechanism, its movable part first moves (section 7-8), then stops (8-9), moves again (9-10) and finally stops - point 10.
The activated mechanism remains at rest (10-11). At point 11, the return to starting position begins. In section 11-12, the mechanism moves, but now in the opposite direction, then stops (12-13), moves again (13-14) and reaches its original position - point 14.
Let's look at another example — fig. 1c, taking into account changes in the values of technological parameters, for example, temperature, over time. Until point 15, the temperature T1 does not change (horizontal line), then it begins to increase (slanted line), and after reaching the value of T2 (point 16) it decreases (slanted line).After a certain time corresponding to point 17, the temperature T3 is set. Similarly, they depict changes in pressure, levels, velocities, etc.
It should be noted that if the time scale is known, then on the horizontal axis it is possible to determine the duration of the part of the process that interests us. Let's look at an example. Let in fig. 1, c on the horizontal line 1 cm corresponds to 10 minutes, and the convexities of sections 15-16 and 16-17 on the horizontal axis are 2.5 and 1.3 cm. This means that the temperature rises 2.5×10 = 25 minutes and decreases 1.3×10 = 13 minutes. It is also necessary to know that the absolute values of the quantities cannot be determined from the diagram. For example, it follows from Fig. 1c that the temperature T1 is lower than the temperature T2, but higher than the temperature T3.
Rice. 1. Diagram of interaction of the first type
Let's take a closer look at the first type of chart. When examining the diagrams, it was found that the operation of relays, contactors, electromagnets is depicted with trapezoids. The height of all trapezoids is the same and corresponds to the nominal current of the device. So, in the diagram of fig. 1, and the switch SB1 (point 1) closed the relay circuit K1. In this case, the action of the K1 relay button switch is indicated by an arrow that goes from the "switch line" to the "relay line". During time 1-2, the relay works, that is, its contacts are switched, the movement of the armature ends, etc. The relay circuit is open at point 4.
During 4-6, the contacts are switched again and come to their initial position. The shaded part of the trapezoid indicates the presence of current in the coil from the main power source.
When, during the operation of the apparatus, the current in its coil changes (for example, part of the resistance of the circuit is shown), then a «step» is formed on the diagram. For example, relays K1 and K2 (Fig. 1, a) are turned on at the same time, but after triggering relay K1, its contact in the circuit of relay K2 opens and activates the resistor R1, the current in the coil of relay K2 decreases with time 2-3 .
As you can see, diagrams of the first type are simple, clear, with certain skills, they can be accurately executed and almost completely replace verbal descriptions of diagrams. From the chart it is easy to determine what is happening on the chart at any given time. To do this, you need to draw a line perpendicular to the time axis at the appropriate place in the diagram and see what it intersects with. So, in fig. 1, and the line corresponding to time t1 shows the following: the SB1 button is pressed, the current in the coil of relay K1 has reached a stable state, and the current in the coil of relay K2 has decreased.
From the available chart, it is easy to determine how much time you need to set for a certain device to achieve a certain result. So it takes time 1-2 (counting along the horizontal time axis) for relay K1 to operate. This means that the SB1 switch must be pressed for at least this time. Returning relay K1 takes 4-6 time.
Therefore, you cannot press SB1 repeatedly (to repeat the same actions) earlier than this time.Questions like: "How long does it take?", "What intervals are needed?", "Are there timing margins and what are they?" Do the starting currents of several motors match in time? ", etc., very often arise among those who design, create and operate devices for automation, telemechanics, electric drives. Such questions simply cannot be solved without an interaction diagram.
It was noted above that the darkened part of the trapezoid indicates the presence of current in the coil from the main power source. The light part is the delay of the mechanism when returning to its original position. We will now consolidate the information obtained by answering the following questions:
1. What happens in the diagram in fig. 1, and after time T2 and T3, as well as in the interval between points 0 and 1?
2. Faster or slower movement of the mechanism (fig. 1, b) during actuation and return?
3. What can be said about the temperature values TI-I and TII-II corresponding to lines I-I and II-II in fig. 1, in?
To reinforce the material, try the following task. In fig. 1, d on the left is given in a one-line image a starting diagram of an electric motor M with a phase rotor (control circuits are not shown). On it: KM1 — contactor in the stator circuit, KM2 -KM4 — accelerator contactors; their contacts in a certain sequence short-circuit the sections of the starting resistor R1. An interaction diagram is drawn to the right. Referring to it, describe the action of the diagram and decide what happens at the time corresponding to line III-III.
A. V. Suvorin